Draw a scaled picture graph and a scaled bar graph to represent a data set with several categories. Solve one- and two-step "how many more" and "how many less" problems using information presented in scaled bar graphs. For example, draw a bar graph in which each square in the bar graph might represent 5 pets.
Generate measurement data by measuring lengths using rulers marked with halves and fourths of an inch. Show the data by making a line plot, where the horizontal scale is marked off in appropriate units -- whole numbers, halves, or quarters.
| Screenshot | Name / Description | Flag? | Rating |
|---|---|---|---|
|
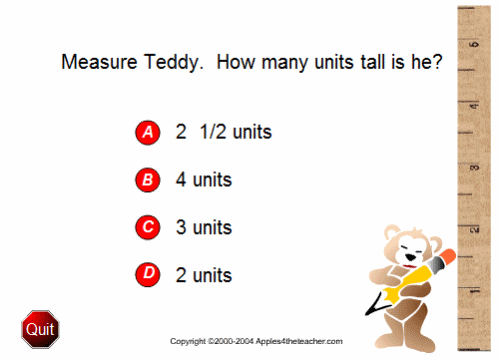
Teddy Measure How tall is the teddy bear? |
 |
|